


Equity & Belonging
Life at Clever
Diversity report 2022
December 15, 2022
Amie Ninh


Explore what diversity looks like at Clever. This post is part of a series focused on equity and belonging.
At Clever, we must ensure that diversity, equity, inclusion and anti-racism are deeply woven into the fabric of our organization, guiding our decision making and actions daily. Only with a sustained focus and commitment to DE&I will we be able to truly unlock new ways of learning for students and add value and impact to classrooms across the country.
A critical measure of progress is how our workforce evolves. This includes reaching our goal of being as diverse as the students we serve in the United States and, now, across more countries as we expand globally. Though it’s only one marker (learn more about other ways we’re progressing our DE&I commitment here), we will continue our annual practice of sharing Clever’s demographic data as a means of accountability and learning.
The data
That said, let’s not bury the lede. Before insights and next steps, we’d like to share the data itself. This information was collected from our human resource information system in October 2022.
For previous data, please see our 2021 Diversity Report. Please also see our notes on methodology at the bottom of this post.
What we’re learning from the data
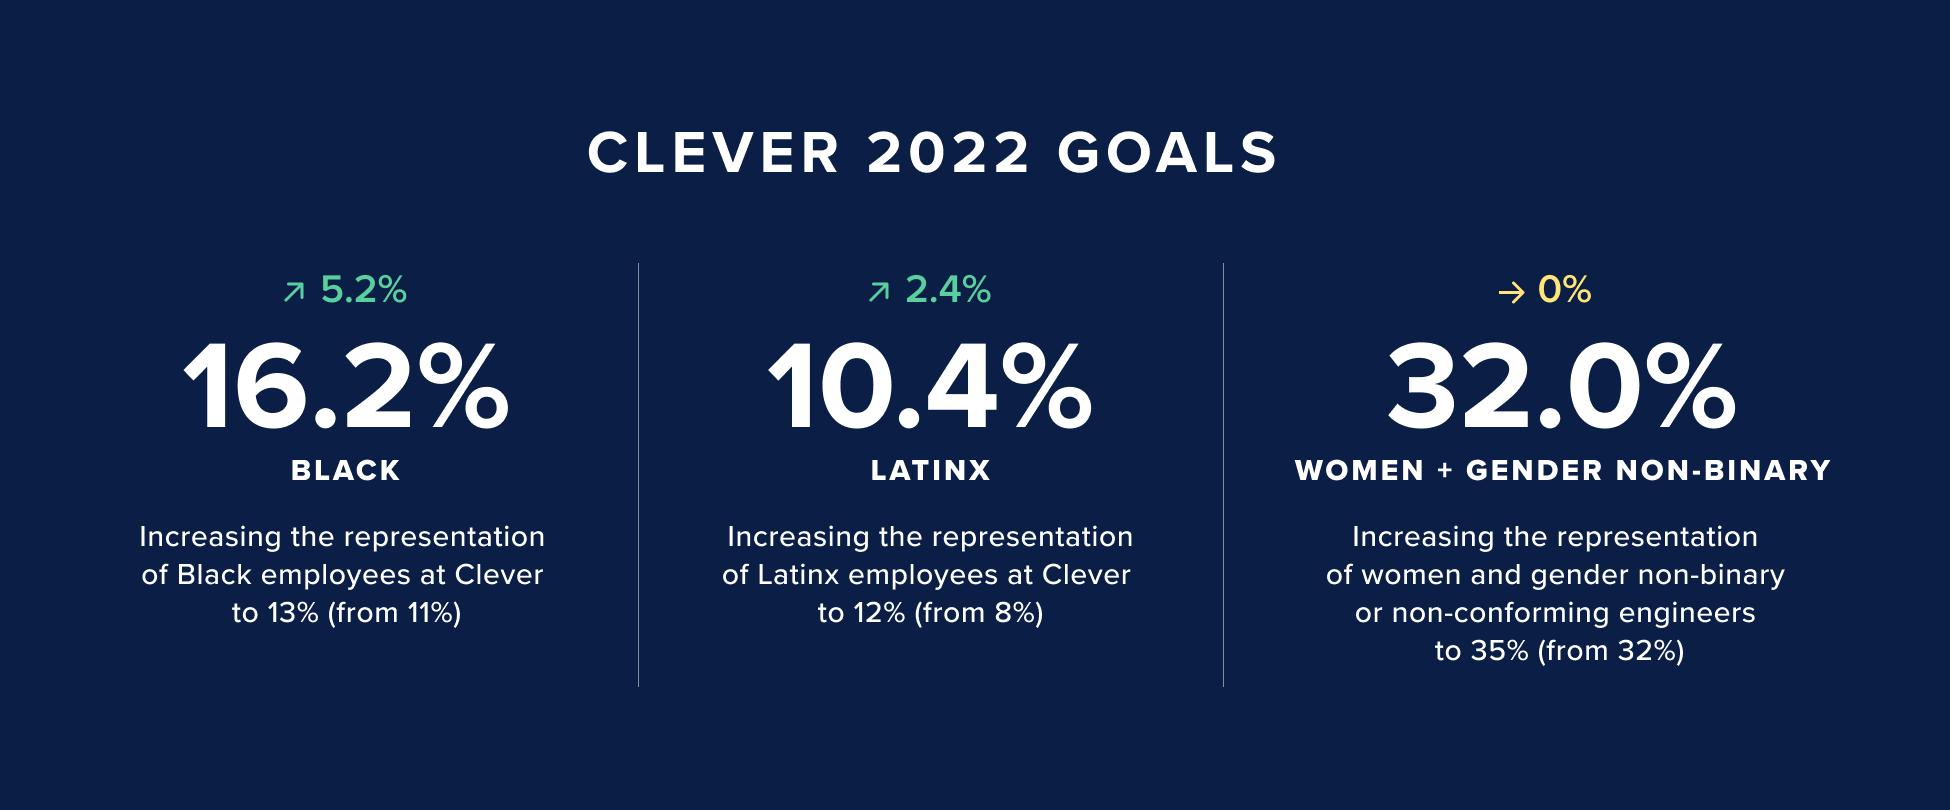
Our long-term goal is that the representation at Clever has as much diversity as the schools we serve. For the first time in 2021, we set company-wide goals to support this. We saw more intentionality and prioritization when we had concrete goals in place so we continued this practice in 2022.
Our 2022 goals included:
- Increasing the representation of Black employees at Clever to 13% (from 11%)
- Increasing the representation of Latinx employees at Clever to 12% (from 8%)
- Increase the representation of women and gender non-binary or non-conforming engineers to 35% (from 32%)
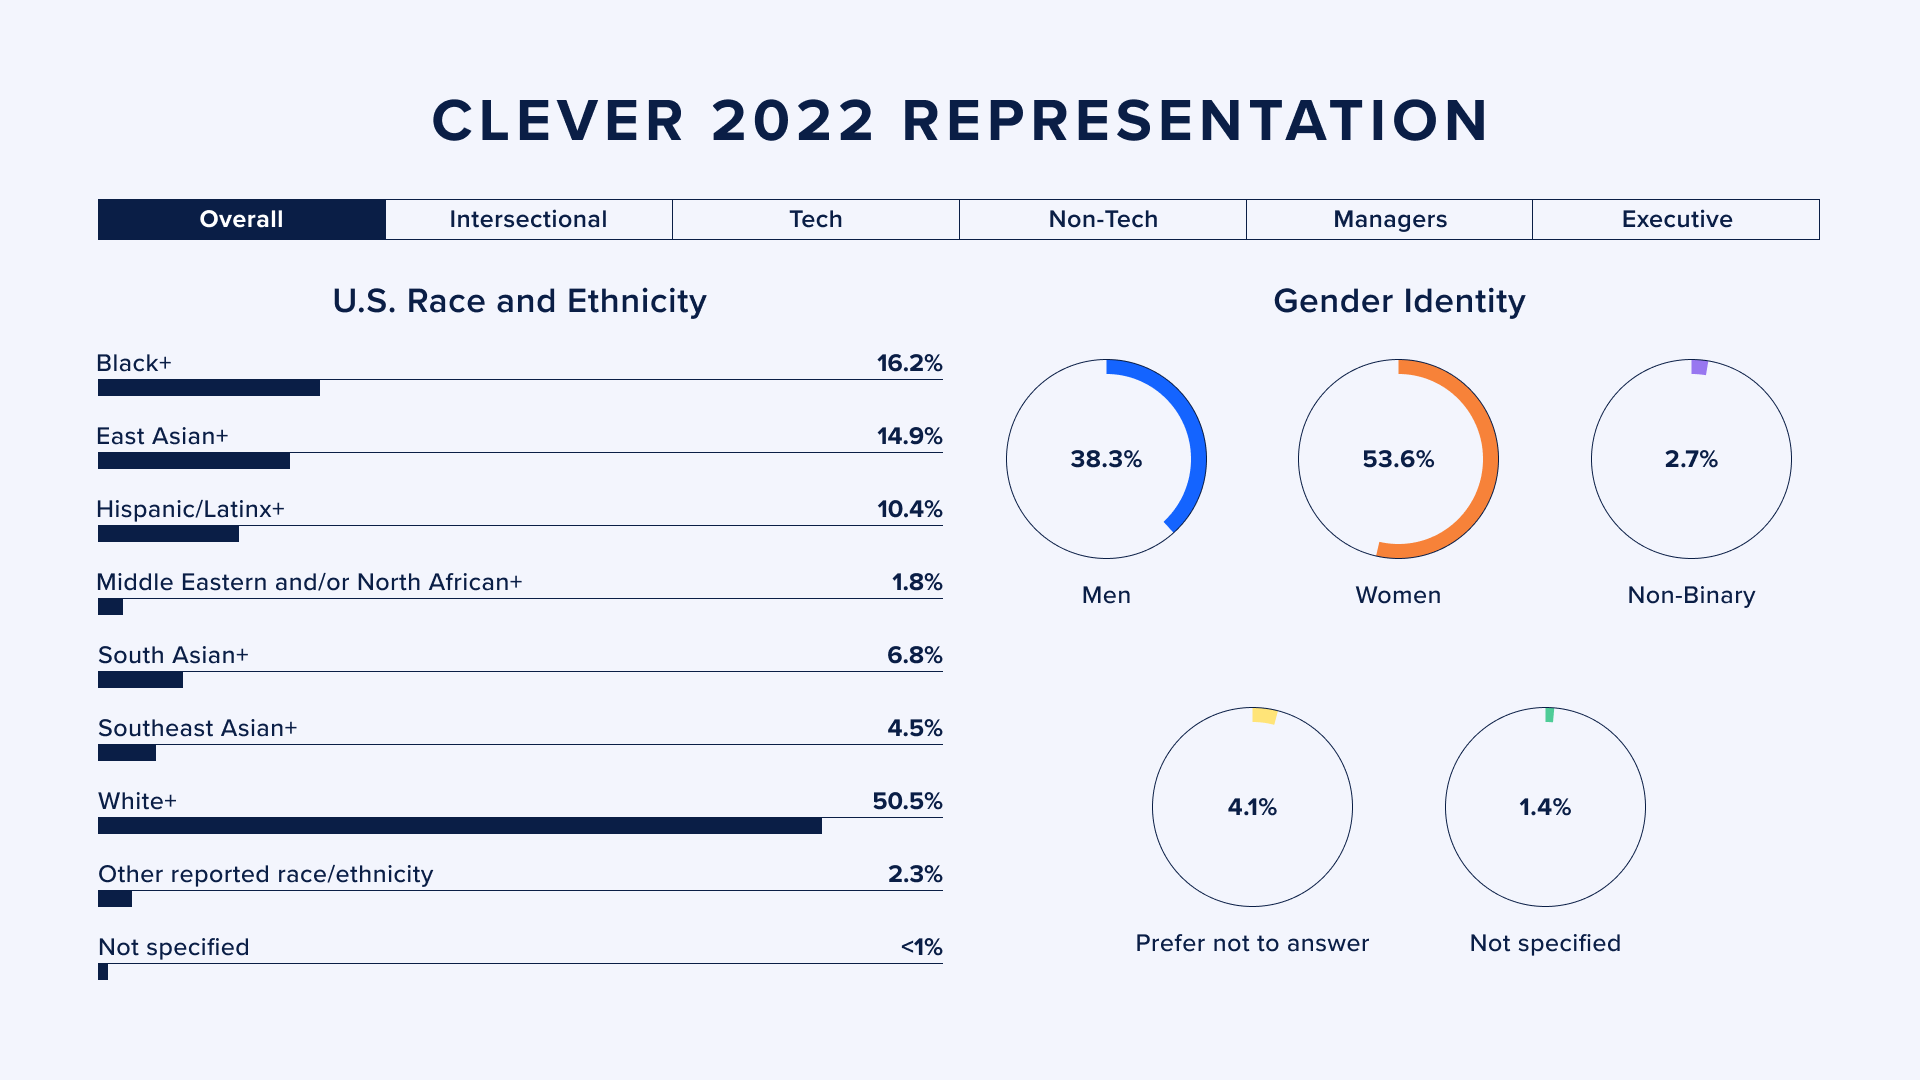
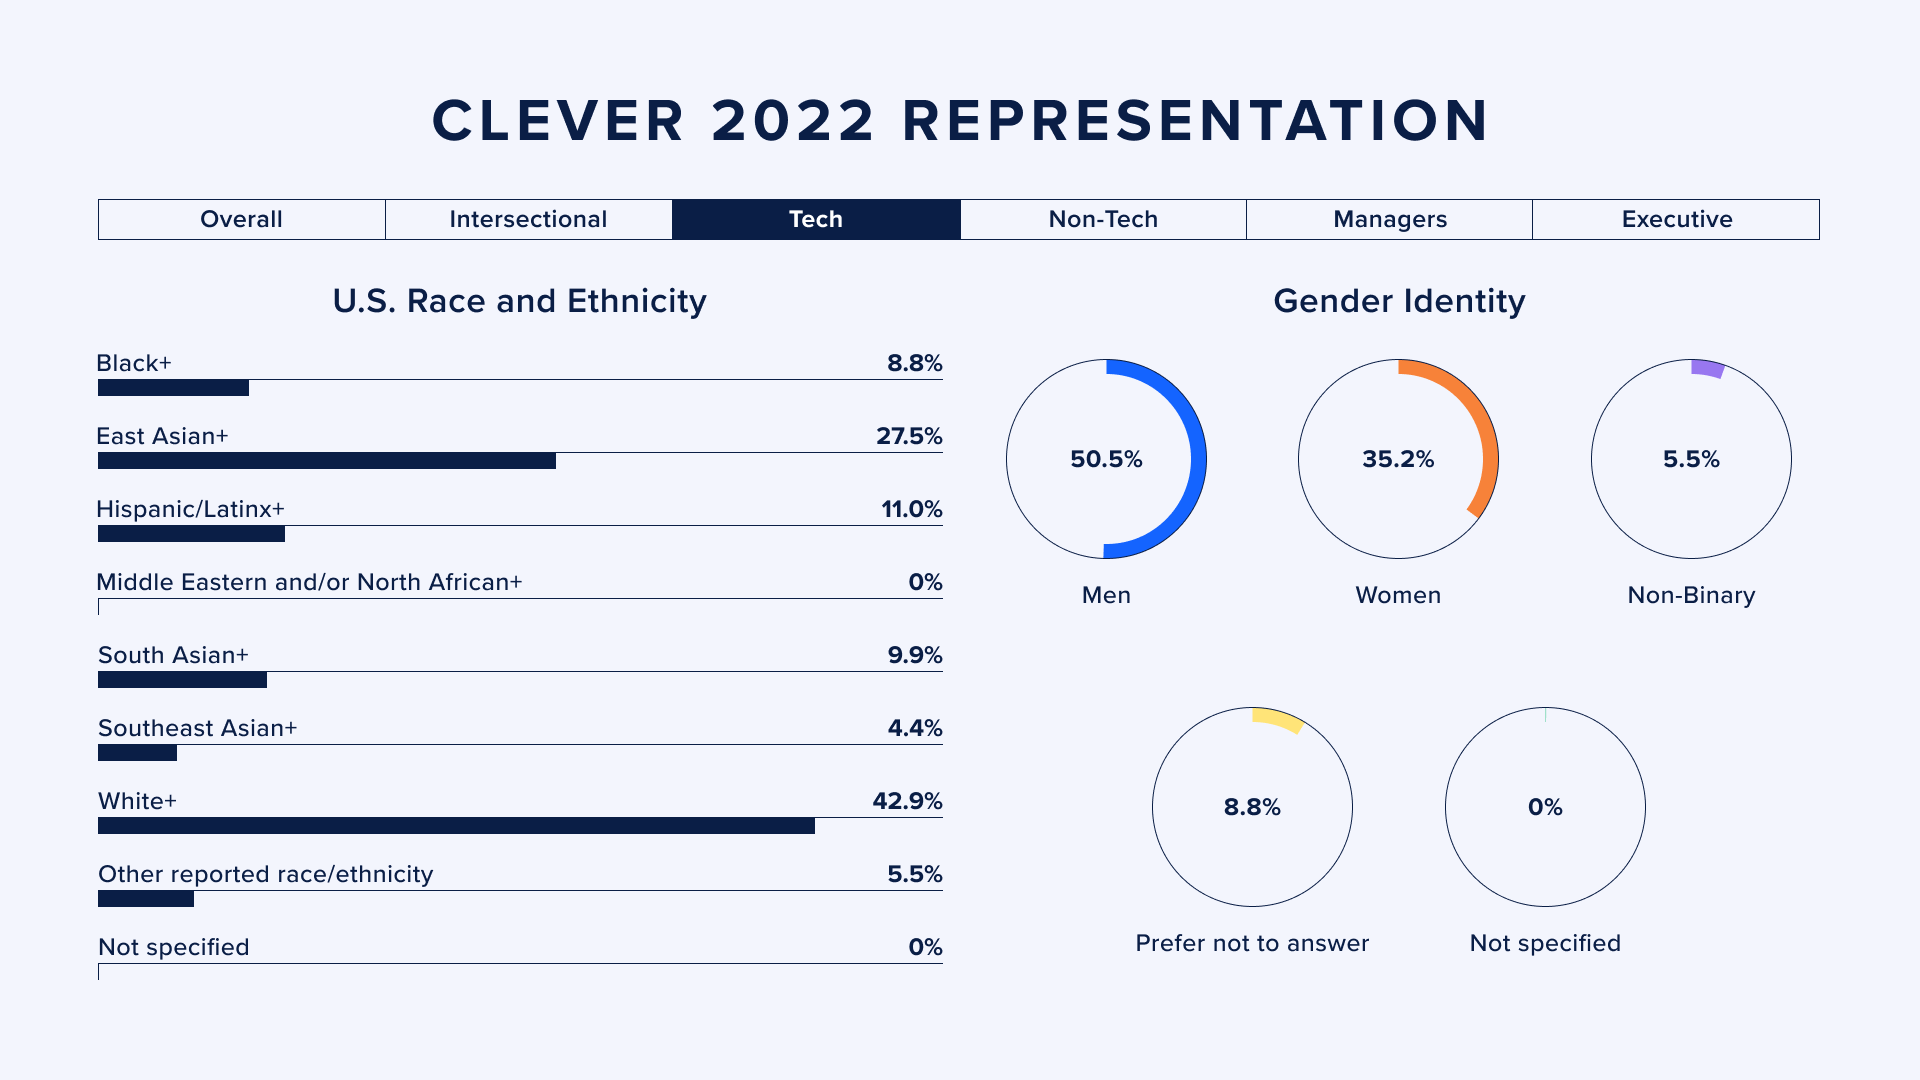
Race/Ethnicity at Clever
For Clever overall, we increased the representation of our Black employees from 11% in 2021 to more than 16% in 2022. The representation of our Latinx employees at Clever was 8% in 2021 and is now 10% in 2022. Unfortunately, we did not meet our 2022 goal for Latinx representation, and this is a future area of opportunity for even more intentionality.
In our technical departments (engineering and product), we also see some shifts in racial diversity. In 2021, Black representation in tech was 3%. In 2022, it stands at 8.8%. In 2021, Latinx representation in tech was 7% and is currently at 11%. We also see a slight increase in Southeast Asian representation.
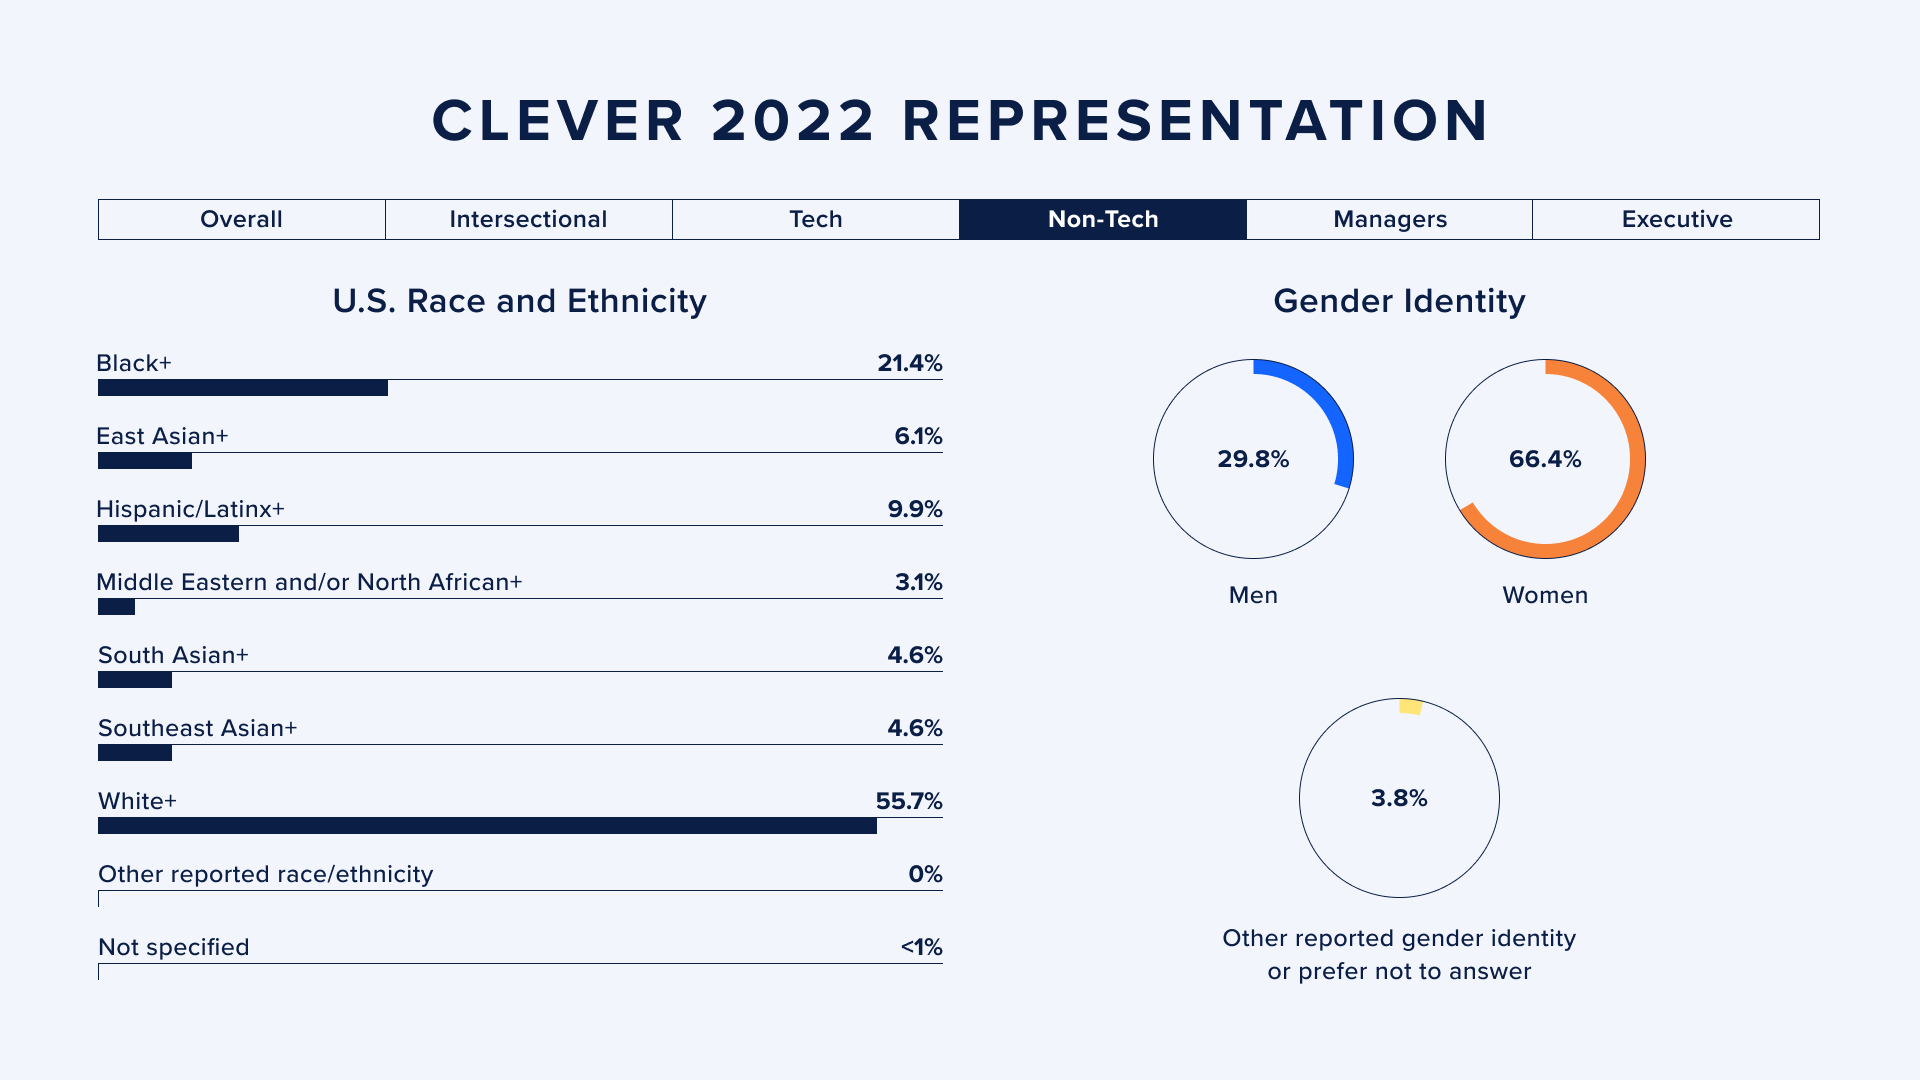
Our non-technical departments have experienced an increasingly diverse employee base. Black, East Asian, and South Asian representation have all increased from 2021. And, excitingly, we’re able to share the representation of Middle Eastern and/or North African employees in this sector of the organization for the first time. However, the representation of Latinx employees has not meaningfully changed.
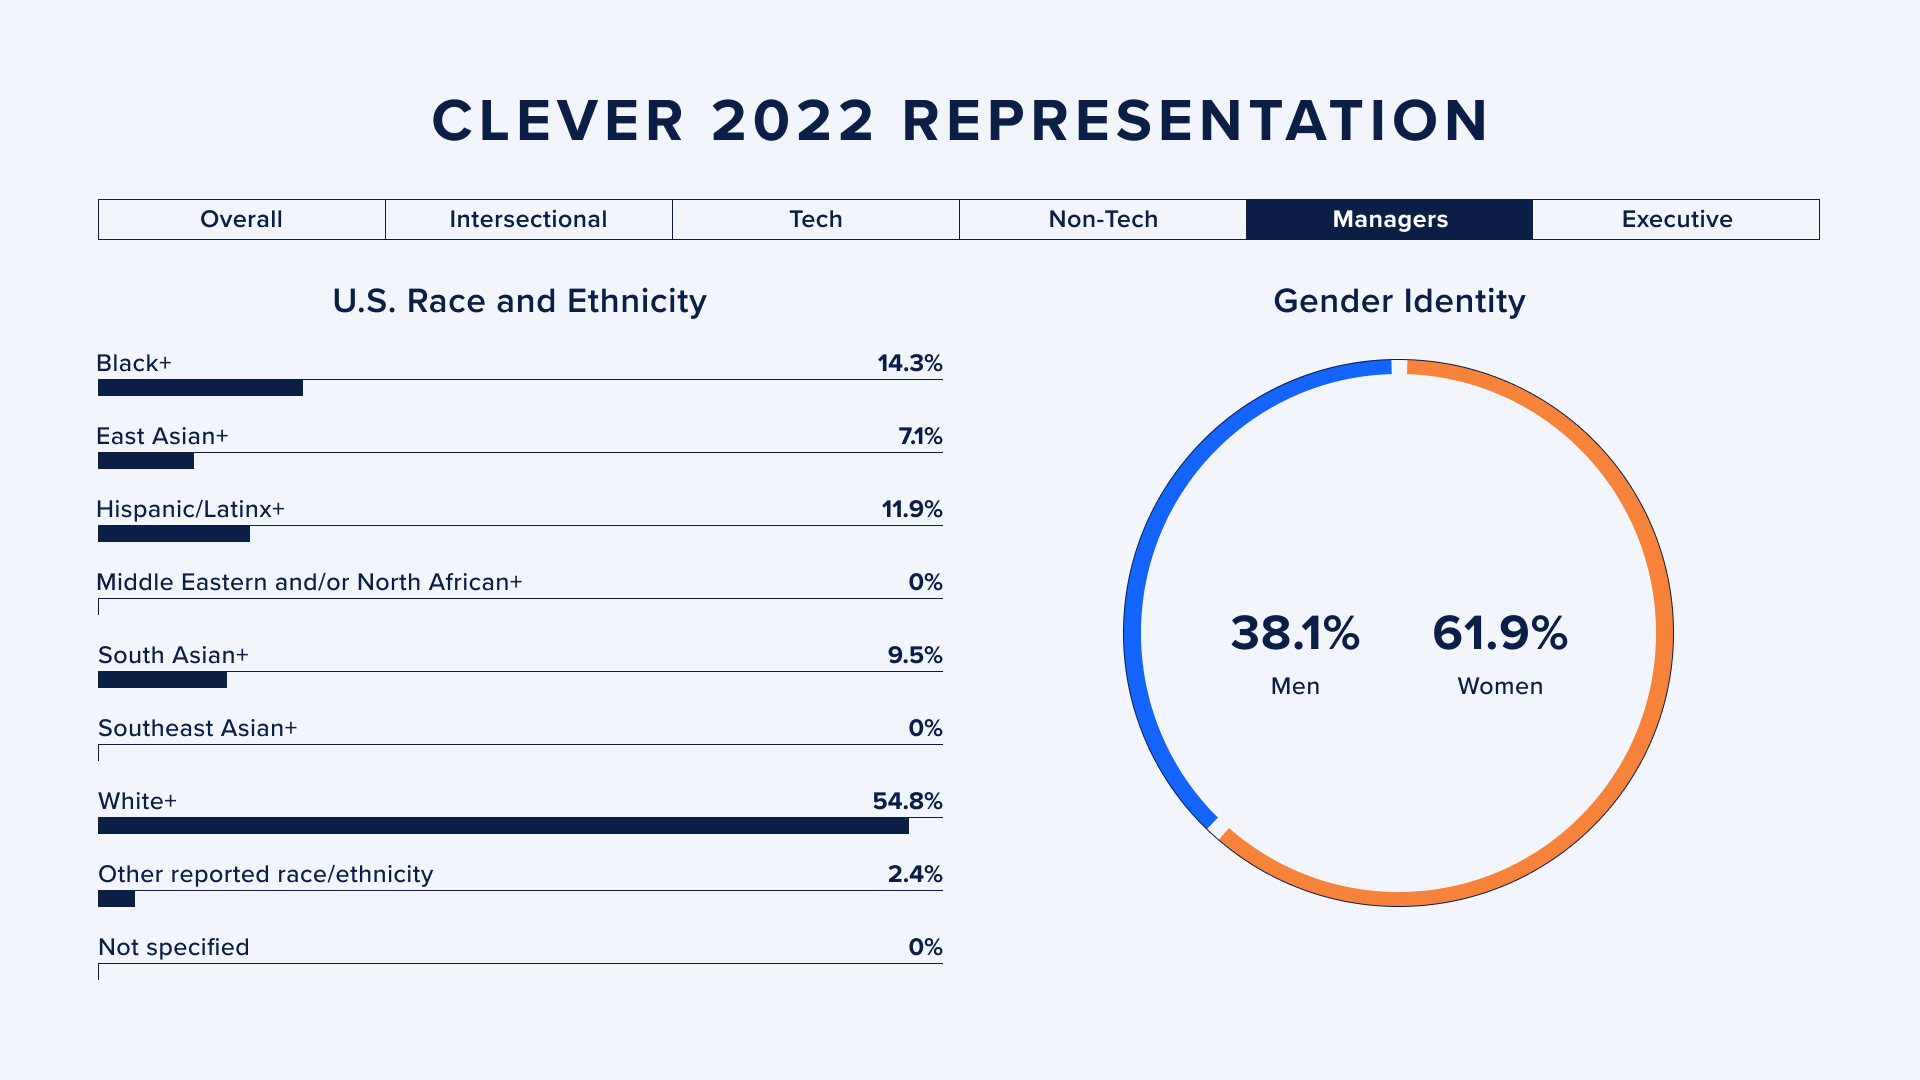
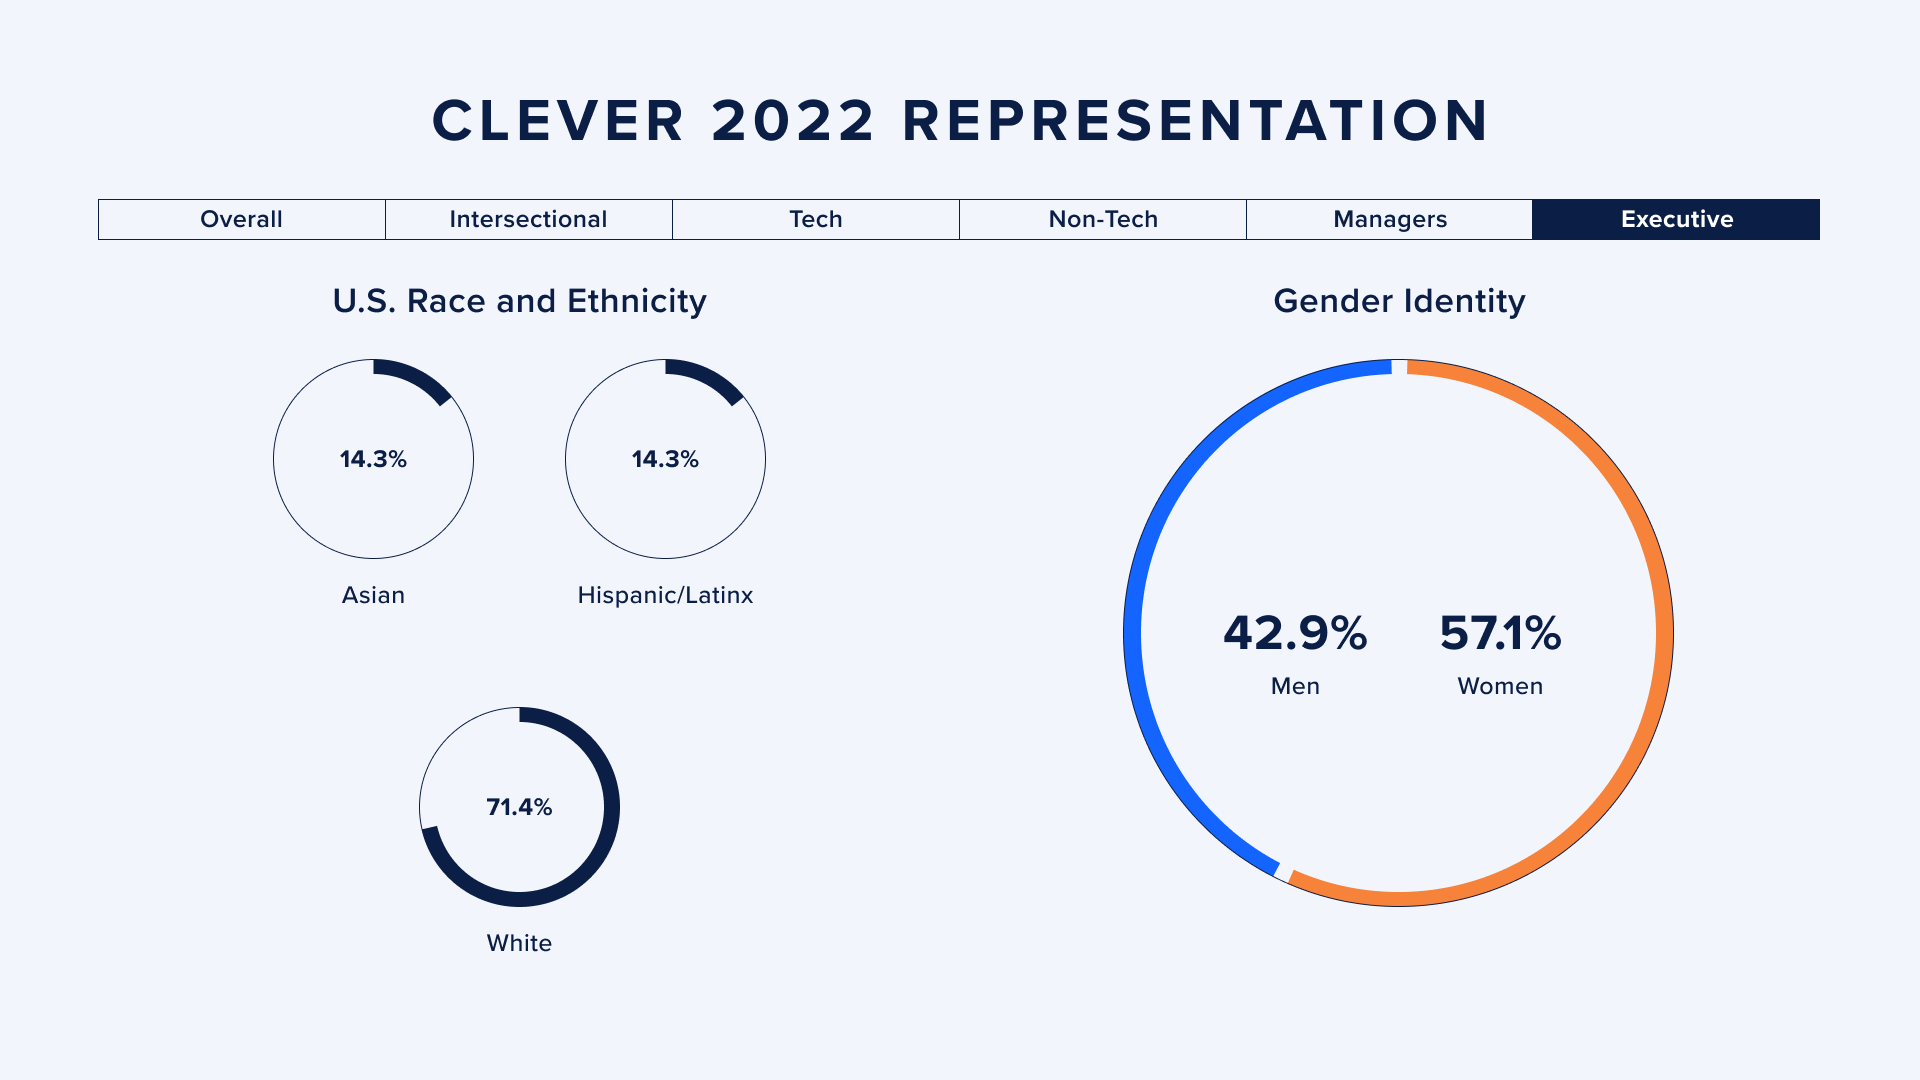
We continue to grow our manager bench each year. While we did not set explicit goals around representation in our manager workforce, there is still significant work needed to further diversify both our manager cohort and our executive team. While there have been some slight changes in 2022, white managers and executive team members continue to make up a dominant portion of Clever leadership.
Gender identity and expression at Clever
Across Clever, we see an overall balanced employee base in terms of gender on the binary. That said, gender representation skews depending on the part of the organization: Our technical departments are predominantly men, and our non-technical departments are predominantly women. We strive to have a more balanced gender representation across departments and teams.
Of course, we also know that gender identity and expression are not on the binary and on a spectrum. 2.7% of Cleverites currently identify as gender non-binary, and we must work to increase the representation of non-binary and/or gender non-conforming employees.
Like most tech companies, our engineering organization has historically been largely male. Thus, it’s critical we focus on more gender diversity here. Currently, 32% of employees in engineering identify as women or non-binary. We did not meet our goal for 2022 but moving forward, we will ensure greater efficacy of our efforts.
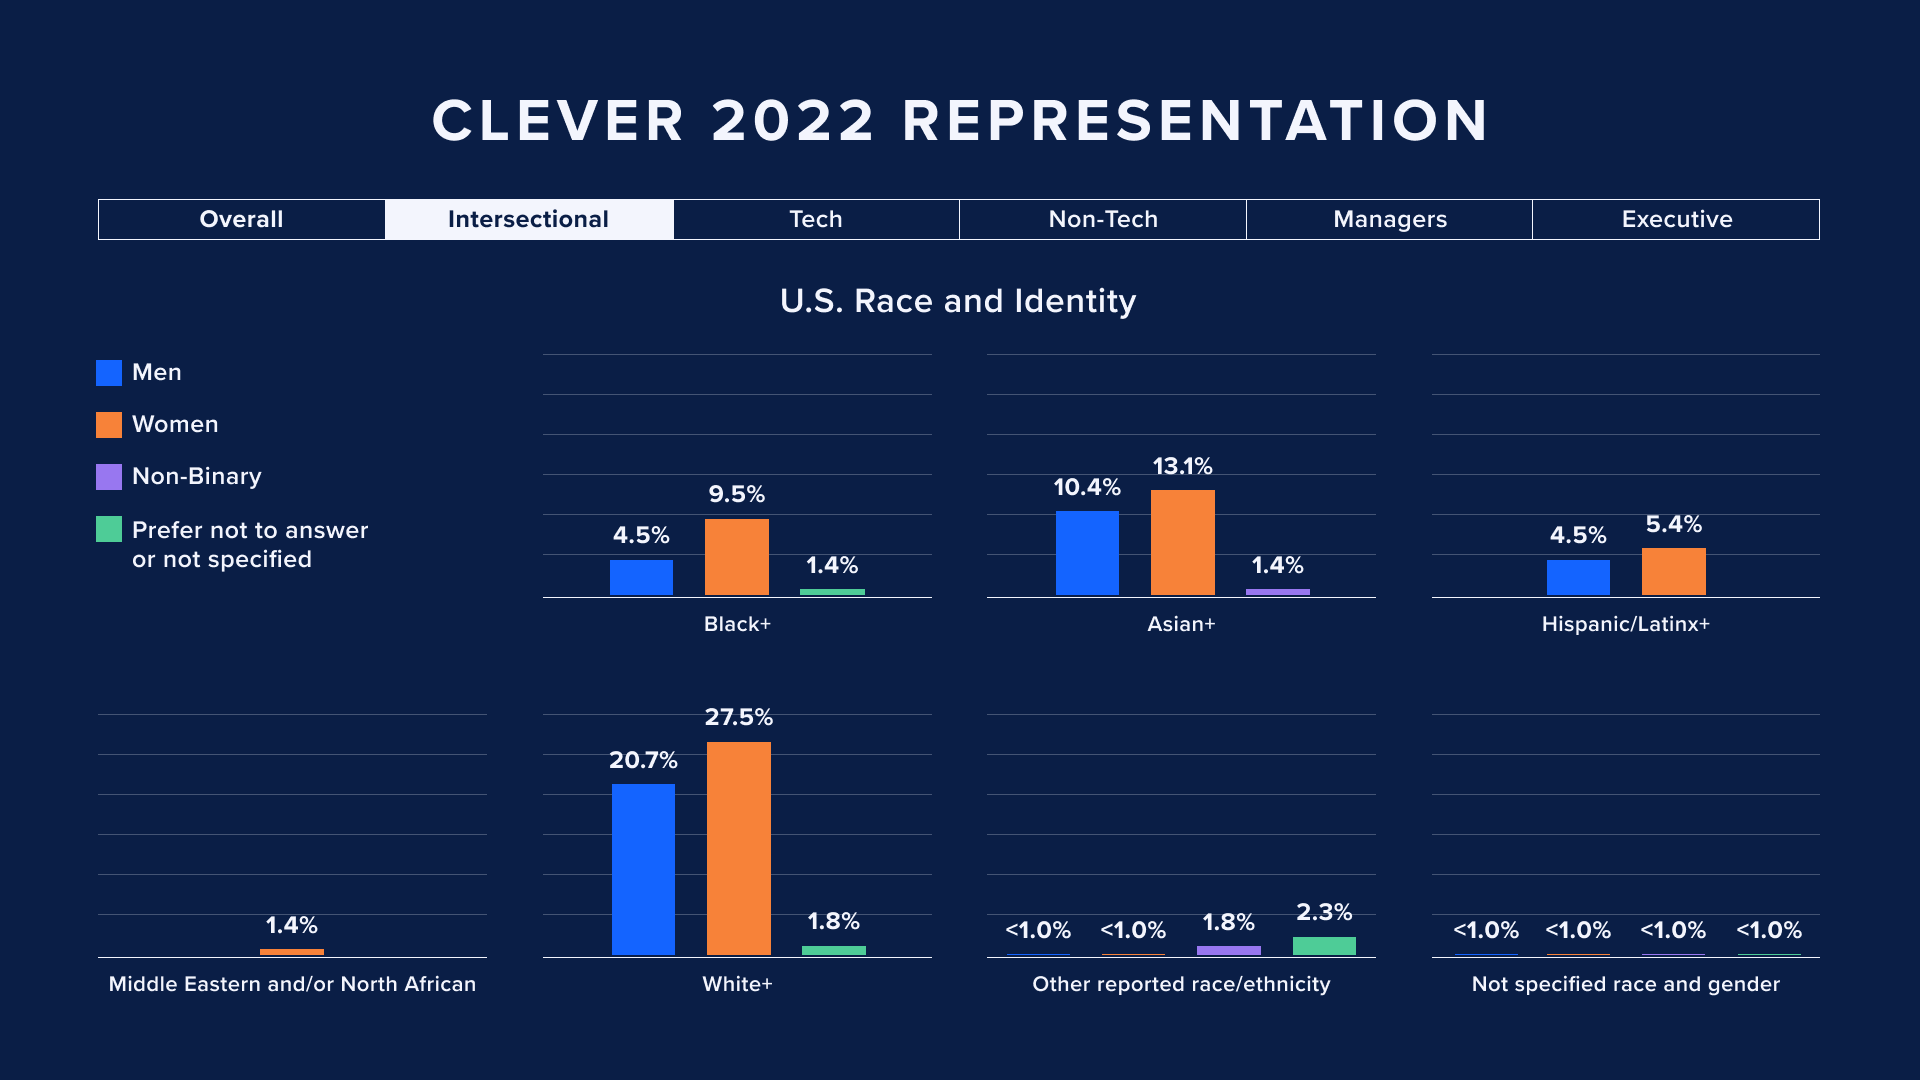
Intersectional race and gender at Clever
Last year, we shared demographic data at the intersection of race and gender for the first time. This is a lens that provides greater nuance for us as an organization. While aggregated data can be helpful at times, it can also erase the distinctive experiences that might exist because of overlapping systems of power that advantage and disadvantage folks differently depending on their social identities.
Some areas of opportunity for us include increasing the representation of Black men, Latino men, and non-binary folks of all races.
What we learned this year from our efforts
At the end of each year, we are given the opportunity to pivot and make improvements to our approach.
Continued foundation building
Undoubtedly, 2021 was focused on setting the foundations and infrastructure to meaningfully support Cleverites to build and retain diverse teams. Throughout last year and 2022, this included conversations with teams and departments around the vital role they play in creating the Clever we want to see for the long-term. Various teams and departments at Clever have taken the initiative to set their own goals to increase diversity based upon their specific demographics, which has been extremely impactful. Hiring managers, recruiters and interviewers are partnering closely together on implementing new strategies, tools and tactics.
This has also meant expanded training and support for hiring managers and interviewers on important topics, such as unpacking common racial and gender dynamics in interview processes, anchoring evaluations on evidence, and interrupting bias in interviews.
We’ve learned that without a solid foundation, we won’t be able to accelerate our DE&I efforts. And foundation building work is ongoing and never stops. When DE&I is not at the forefront, it can easily be forgotten, especially amid time pressures and competing priorities. We always have to keep DE&I top of mind, which involves ongoing enablement and support as well as powerful relationships across the organization that create more accountability to mitigate bias in everything we do.
Evolving our practices in recruiting/hiring
The way that we recruit and hire can always be improved, and this year we continued to refine our practices and processes.
We believe that examining pass through rates at each stage and shifting our processes is a non-negotiable for more equitable recruiting and hiring practices. Across several departments, we changed elements about the process to ensure we’re evaluating on a more inclusive set of criteria. We clarified roles and responsibilities among key stakeholders to create more accountability and ownership. We also finalized a values interview – not to assess “fit,” which we know can lead to more homogenous workforces. Rather, we want to connect with candidates who find resonance with our values and culture tenets, including a deep belief in the importance of DE&I.
Last year, we introduced our own version of the Rooney Rule to ensure that diversity stays top of mind in every stage of our recruitment process. While this was initially for management roles only, we started to experiment with expanding this practice into other roles across departments.
We also explored (and are still exploring) other ways to create a diverse pipeline of candidates from revamping our referral process to increasing our external partnerships.
We’ve learned a lot about constant evolution this year. If we’re not proactive about making needed adjustments and improvements, we’ll lose momentum and fail to catch inequities in our process. We may not get it perfect on the first try but we have to be dedicated to intentionality, sustained effort, and consistent examination required for change. Any system that impacts people (ex. hiring) will default to inequity and can create outcomes that aren’t what we strive for. Thus, we have to be vigilant and ask ourselves tough questions about why things look the way they do, even if the answer isn’t comfortable to grapple with.
Representation is not everything.
While increasing diversity at Clever is vital, it’s insufficient to become an equitable and anti-racist organization. We’re also committed to internally focusing on employee retention and engagement, particularly for those who are most marginalized. We must create an environment where all employees, particularly those most marginalized, have access to opportunities and growth. We also have to take an equity lens to understand the impact we have with our products and services. Additionally, as an edtech organization, we have a responsibility to advocate for more equity and inclusion across the entire education ecosystem.
To find out more about our efforts around DE&I from 2022, please see this blog post here.
A note on methodology
In 2022, we used a different data source than in previous years. Prior to this year, we administered an organization-wide survey. However, this survey created an imperfect data set since all employees did not usually complete it. We switched to a new human resource information system this year, which provided new, more inclusive and more complete capabilities for understanding our company demographics. Because we have different data sources from 2021 to 2022, this makes comparisons across years challenging. Data comparisons in this report are not necessarily 1:1. Moving forward, we will have cleaner, more accurate and more complete data overall, which will enable more quality data comparisons in the future.
For all data presented here, our reporting minimum was more than 3 employees who identified with groups. Otherwise, we risked potentially violating privacy.
We count multiracial people as a member of all the racial/ethnic categories they identify with; this is denoted with a plus sign. Because of rounding and how we ensure the identities of multiracial people are fully honored, the individual percentages may not add up exactly to the overall percentage.
To learn more about DE&I at Clever, visit our website.
The Clever Diversity Report 2022
Click here to download the full report.

More to read
Company
District
February 29, 2024
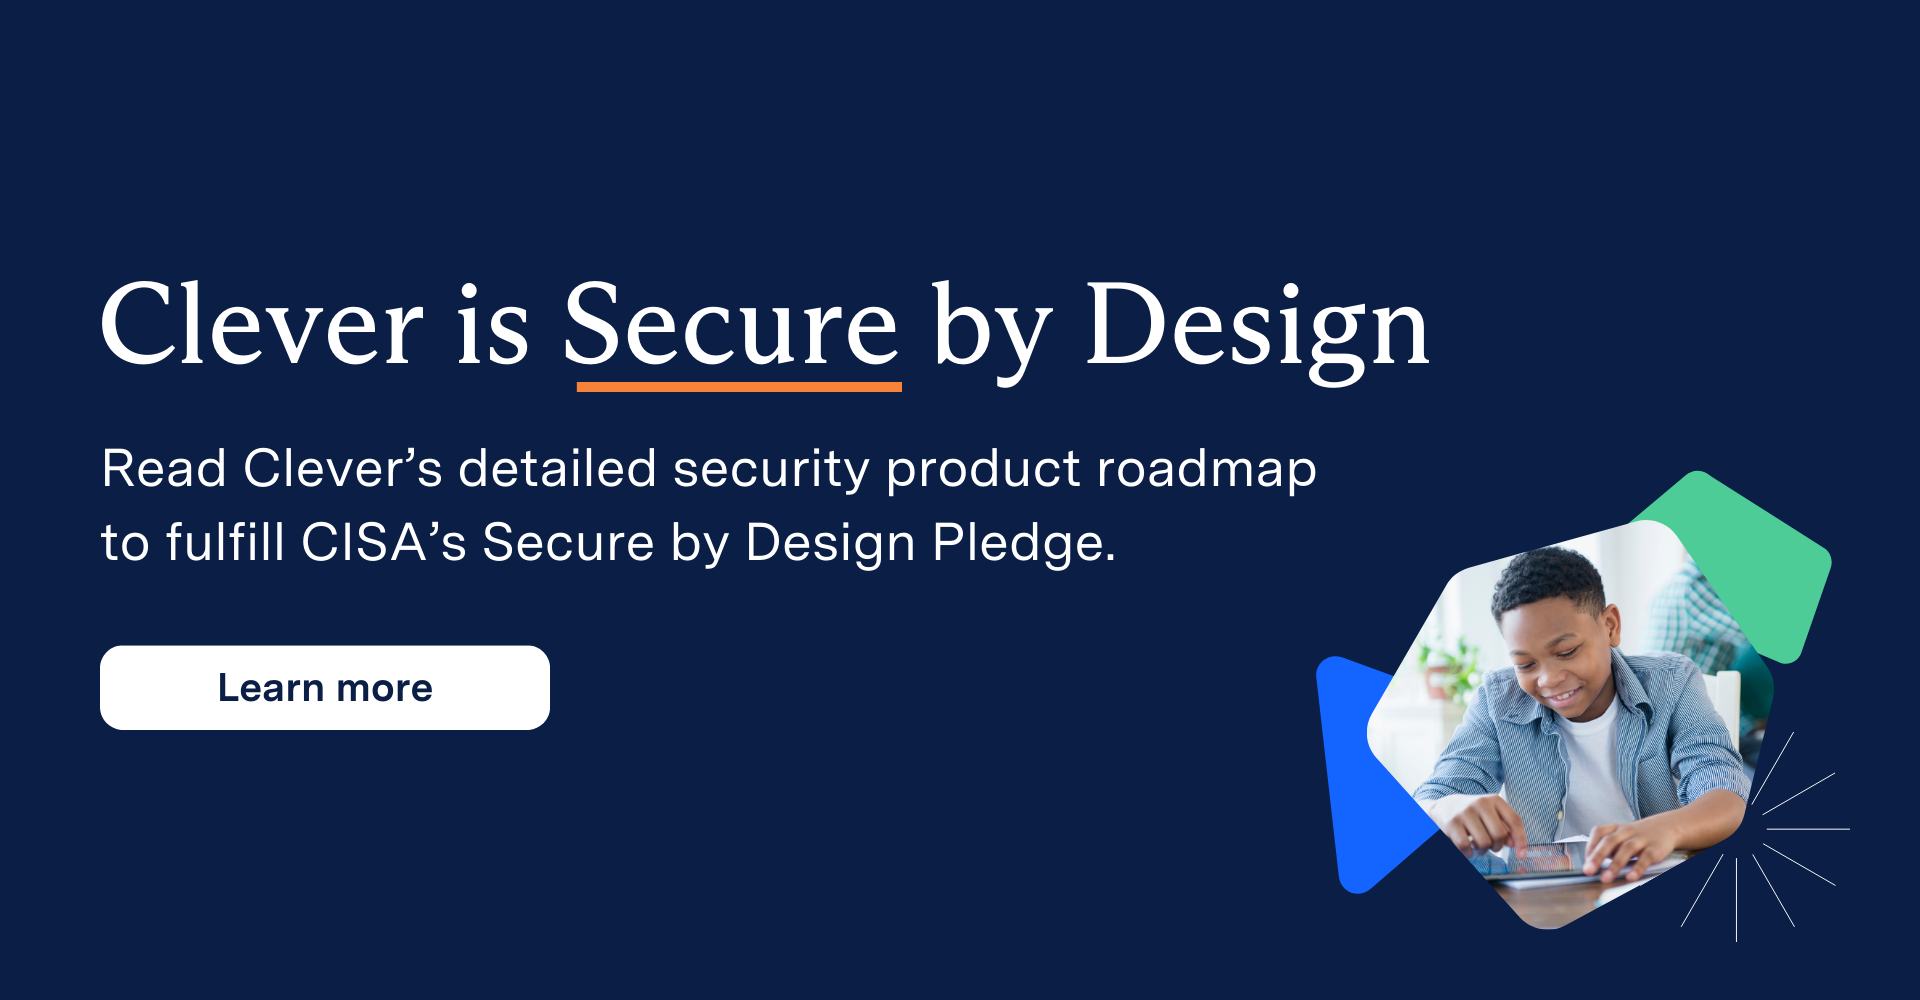
Clever is Secure by Design: Roadmap for 2024Read Clever’s detailed Secure by Design product roadmap – a critical aspect of fulfilling the Secure by Design Pledge. In August 2023, I had the privilege of joining the Back to School Safely Cybersecurity event hosted by First Lady Dr. Jill Biden at the White House. In partnership with the U.S. Cybersecurity and Infrastructure Security […]
Company
Uncategorized
February 12, 2024
Former teacher launches her second career as an engineerLearn about Sophia's experiences, challenges, and triumphs in her transition from teaching to engineering, and find out why she chose Clever as a launchpad for her second career.
Company
December 18, 2023
Year in review: Diversity, equity, and inclusion in 2023Explore how we evolved our diversity, equity and inclusion efforts in 2023 and learn more about our journey.