


Equity & Belonging
Diversity and inclusion report 2017
February 26, 2018
Spencer Caton


This post is the continuation of a series focused on diversity and inclusion. View all posts in the series.
In August of 2015, Clever published its first blog post on diversity and inclusion. In it, we released our demographic statistics, and the reasons we thought measuring and sharing that data is so important.
Since then, we’ve continued to measure. But we’ve also gone beyond just reporting our numbers. We showed how we measure, shared tips on hiring recruiters who are committed to diversity, and highlighted some methods we use to ensure our leadership hiring is as equitable as possible.
In continuing to release these statistics and share our best practices, we hope to:
- Highlight the opportunity to improve diversity in the technology industry and share our incremental successes.
- Hold ourselves accountable as we work to improve diversity and inclusion on our team.
- Encourage other companies to do the same.
So where are we two years after that first blog post? Below are the results of our 2017 demographic survey, which we administered in January 2018 across our employee base. As always, a tabular version of this data is available for the visually impaired.
GENDER
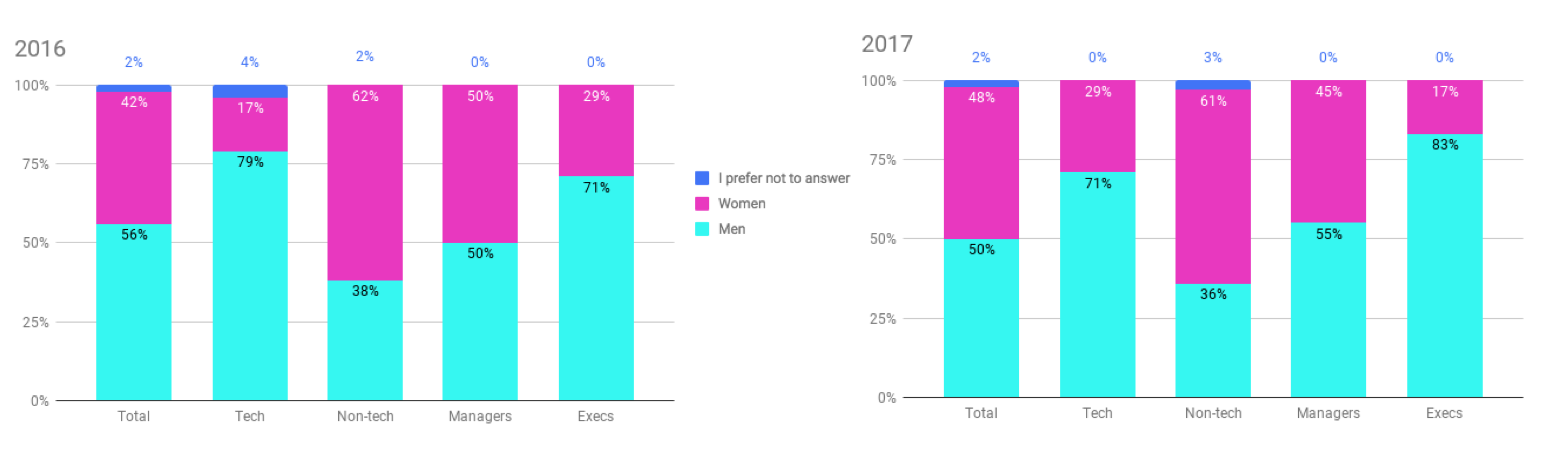
Our 2015 and 2016 results showed that women were underrepresented on the Clever team, particularly in technical roles and in management. Men still outnumber women in technical teams, but the gap is closing.
In 2016, only 17% of our technical team was women. This past year, that number increased to 29%. Similarly, the overall percentage of female employees at Clever has grown from 42% to 48% in that same time.
However, there’s still work to be done on this front, particularly with our management and executive teams. Both have seen slight dips in their percentage of women since 2016.
None of the employees surveyed indicated that they identify as a gender other than “man” or “woman.”
RACE AND ETHNICITY
The majority of our team identifies as white. There’s also a large Asian minority. Black, Latino/a or Hispanic, multiracial employees, and employees of other races make up about 20% of the team. Native American was the only group measured that was not represented at Clever.
Compared to 2016, the percentage of employees identifying as Black or “Latino/a or Hispanic” increased. However, the percentage of employees identifying as white has increased overall.
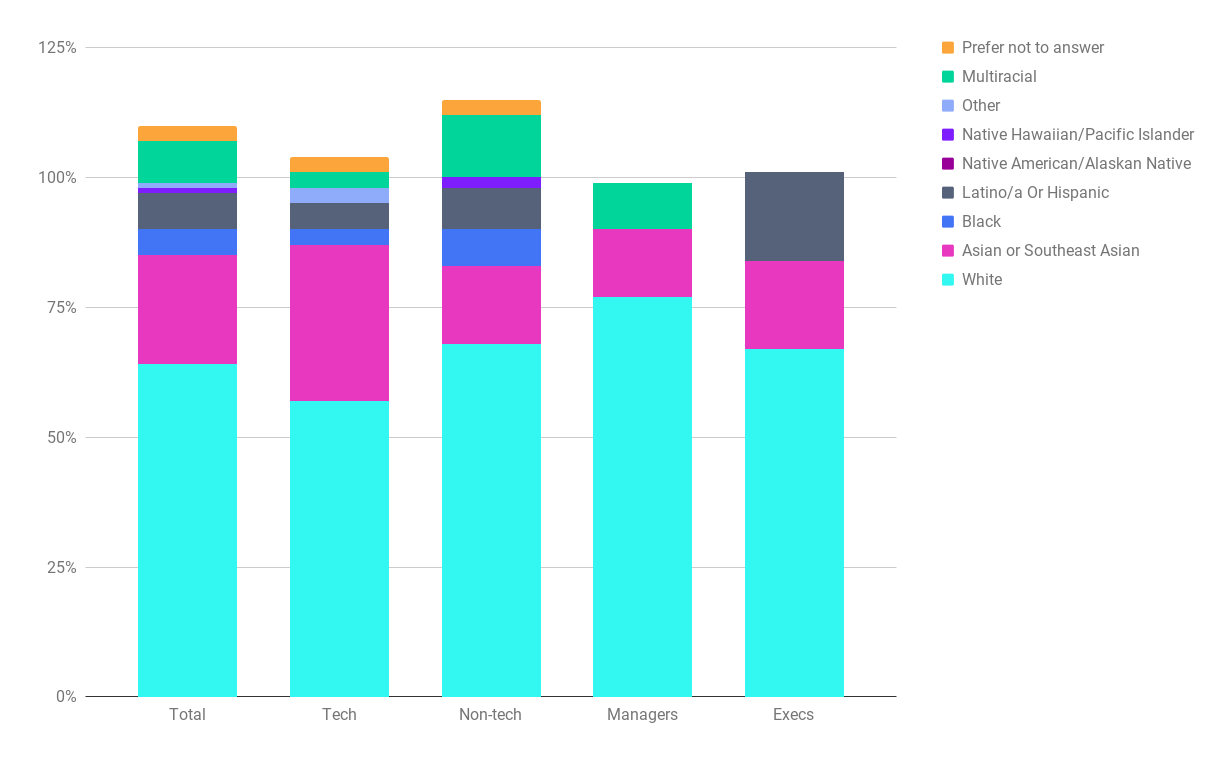
Note: Employees were able to choose multiple options, which is why some categories exceed 100%.
AGE
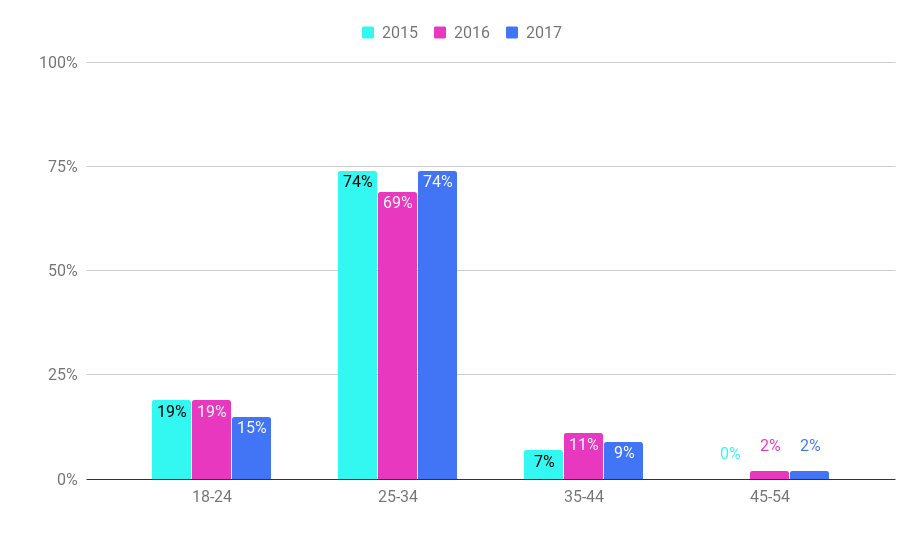
Clever skews younger than average when compared to the overall U.S. workforce, with the majority of the team under 30-years-old and no employees over 55.
RELIGION
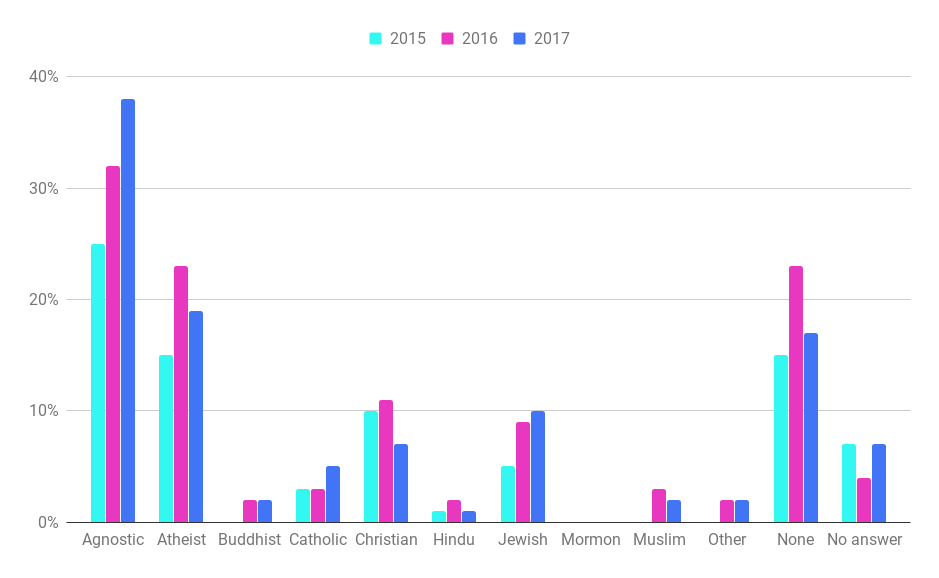
The Clever team is largely non-religious, but roughly 30% report having religious views of some kind. Mormonism remains the only religion we measured which no Cleverites report practicing.
SEXUALITY
Clever’s team largely identifies as straight. Note the non-straight sexuality results are aggregated to protect respondent anonymity.
- 86% Straight
- 11% Lesbian, gay, bisexual, queer, or asexual
- 4% Prefer not to answer
ABILITY
Consistent with data from 2015 and 2016 data, Clever’s team largely identifies as able.
- 87% No difficulty
- 8% Some difficulty
- 6% Prefer not to answer
PRIMARY CARETAKER OF A MINOR
A very small, but growing, number of Clever employees are parents or guardians.
- 91% No
- 8% Yes
- 1% Prefer not to answer
VETERANS
As in 2016, we have no team members who report being a veteran.
- 99% No
- 0% Yes
- 1% Prefer not to answer
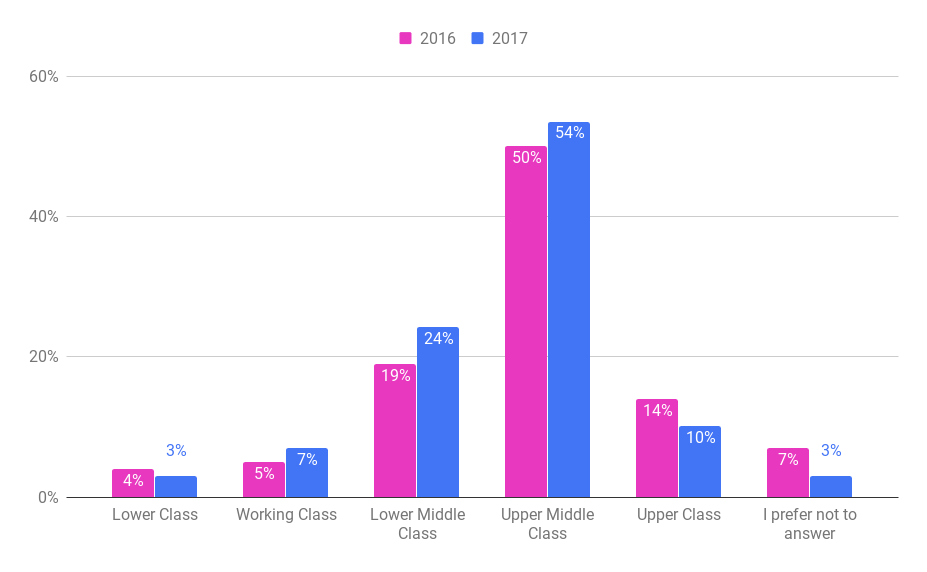
SOCIOECONOMIC BACKGROUND/EDUCATION ACCESS
Most Clever employees report growing up in middle class, and particularly upper middle class, families.
Almost all Clever employees report having earned a bachelor’s degree or higher.
- 1% Completed some college
- 68% Bachelor’s degree
- 29% Master’s, Ph.D., or other post-baccalaureate study
- 1% Prefer not to answer
- 1% High school graduate
WHAT’S NEXT
Over the next year, we’ll continue to share lessons we learn and stumbling blocks we run into as the Clever team grows. We’re looking forward to keeping you updated on our progress and efforts throughout 2018!

More to read
Company
District
February 29, 2024
Clever is Secure by Design: Roadmap for 2024Read Clever’s detailed Secure by Design product roadmap – a critical aspect of fulfilling the Secure by Design Pledge. In August 2023, I had the privilege of joining the Back to School Safely Cybersecurity event hosted by First Lady Dr. Jill Biden at the White House. In partnership with the U.S. Cybersecurity and Infrastructure Security […]
Company
Uncategorized
February 12, 2024
Former teacher launches her second career as an engineerLearn about Sophia's experiences, challenges, and triumphs in her transition from teaching to engineering, and find out why she chose Clever as a launchpad for her second career.
Company
December 18, 2023
Year in review: Diversity, equity, and inclusion in 2023Explore how we evolved our diversity, equity and inclusion efforts in 2023 and learn more about our journey.